
Map 1
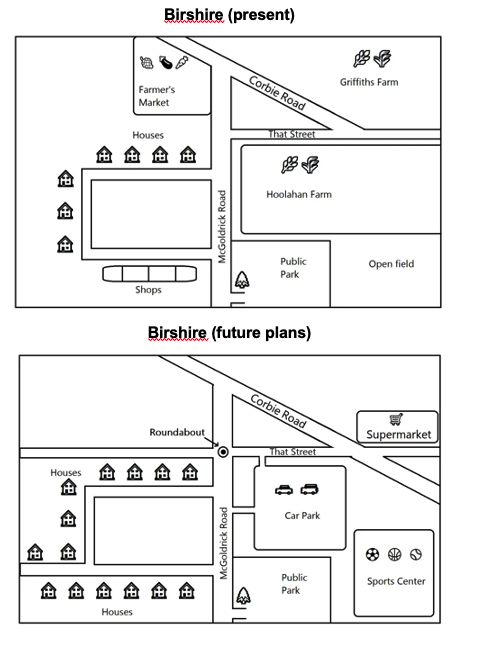
The maps below show the center of a small town called Birshire as it is now, and plans for its development.
Summarize the information by selecting and reporting the main features, and make comparisons where relevant.
Write at least 150 words.
MAP 2
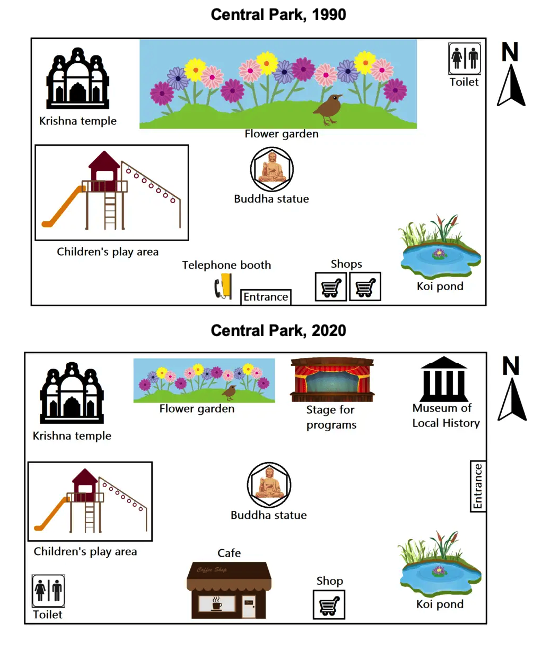
The plans below show the layout of a public park in 1990 and in 2020.
Summarize the information by selecting and reporting the main features, and make comparisons where relevant.
Write at least 150 words.
MAP 2
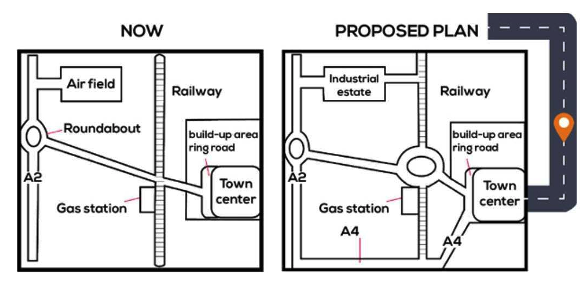
The plans below show the layout of a proposed plan
Summarize the information by selecting and reporting the main features, and make comparisons where relevant.
Write at least 150 words.
MAP 3
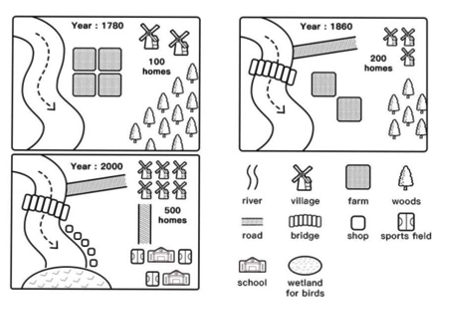
The maps below show the changes that occurred to a town named Willingtown in 1780, 1860 and 2000
Summarize the information by selecting and reporting the main features, and make comparisons where relevant.
Write at least 150 words.
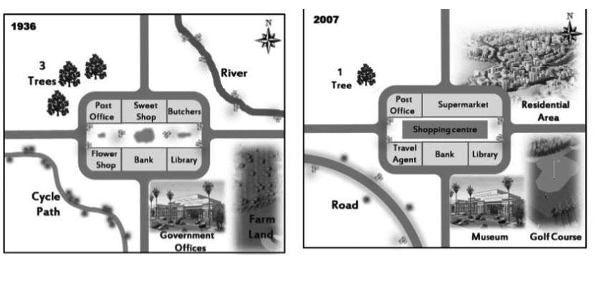
MAP 4
The maps below shows the town of Lynnfield in 1936 and then later in 2007.
Summarize the information by selecting and reporting the main features, and make comparisons where relevant.
Write at least 150 words.
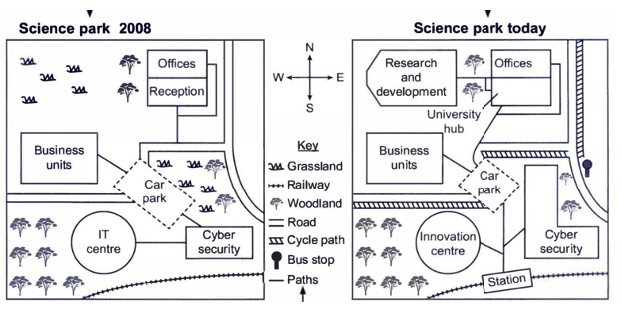
MAP 5
The maps below show a science park in 2008 and the same park today.
Summarize the information by selecting and reporting the main features, and make comparisons where relevant.
Write at least 150 words
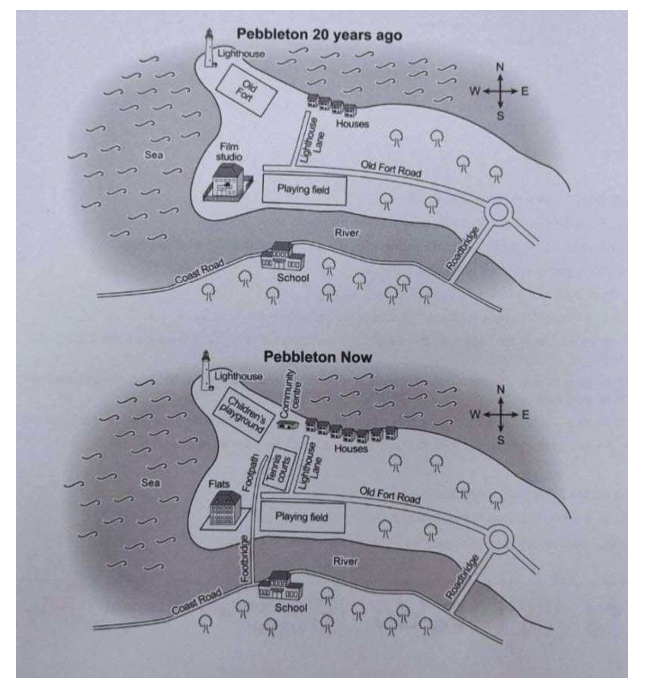
MAP 6
The maps below show Pebbleton 20 years ago and today.
Summarize the information by selecting and reporting the main features, and make comparisons where relevant.
Write at least 150 words.
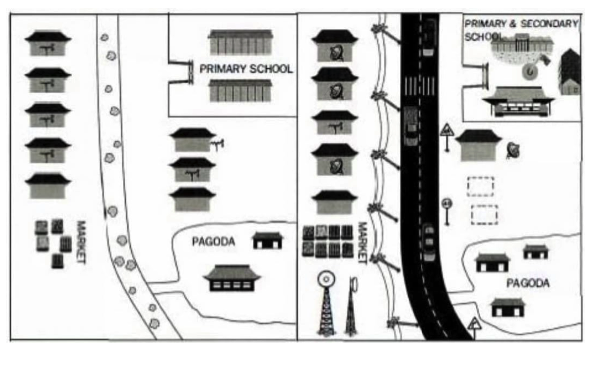
MAP 7
The maps below show Pancha Village in 2005 and 2015.
Summarize the information by selecting and reporting the main features, and make comparisons where relevant.
Write at least 150 words.
MAP 8
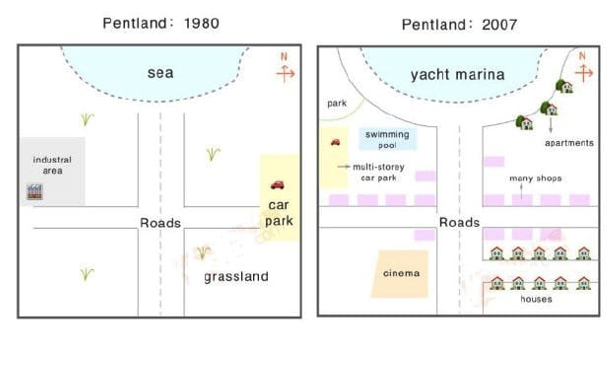
The maps show the change of Pentland from 1980 to 2007
Summarize the information by selecting and reporting the main features, and make comparisons where relevant.
Write at least 150 words
MAP 9
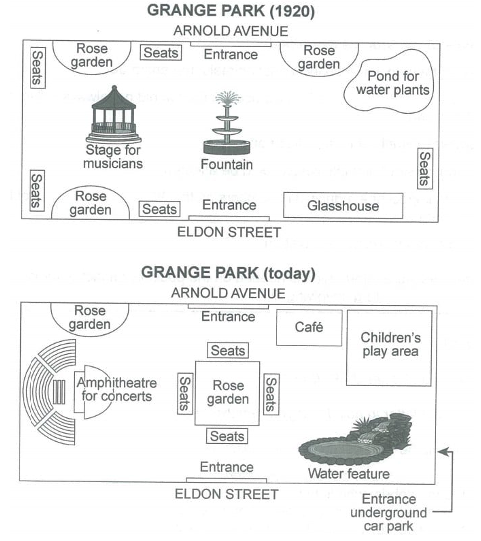
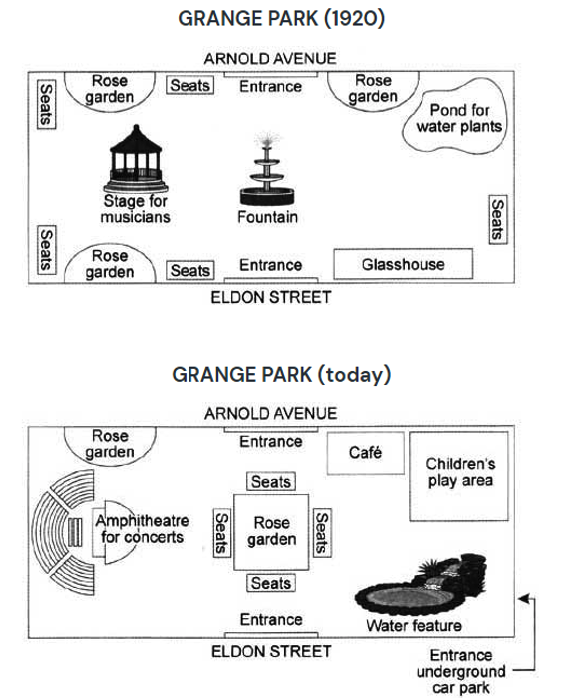
The plans below show a public park when it first opened in 1920 and the samepark today.
Summarize the information by selecting and reporting the main features, and make comparisons where relevant.
Write at least 150 words.
MAP 10
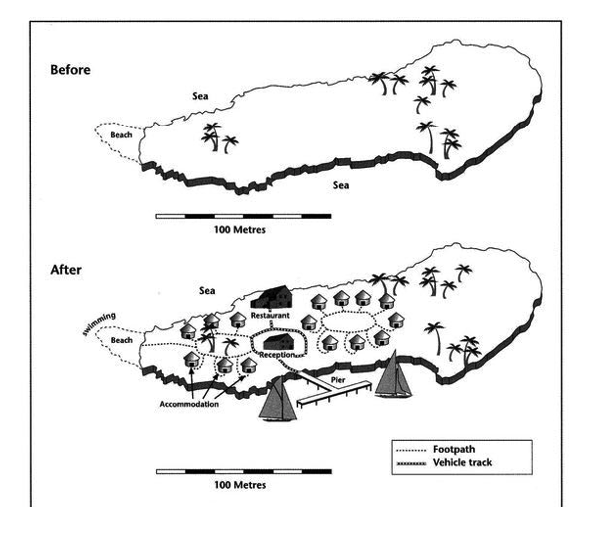
The two maps below show an island, before and after the construction of some tourist facilities.
Summarize the information by selecting and reporting the main features, and make comparisons where relevant.
Write at least 150 words.
MAP 11
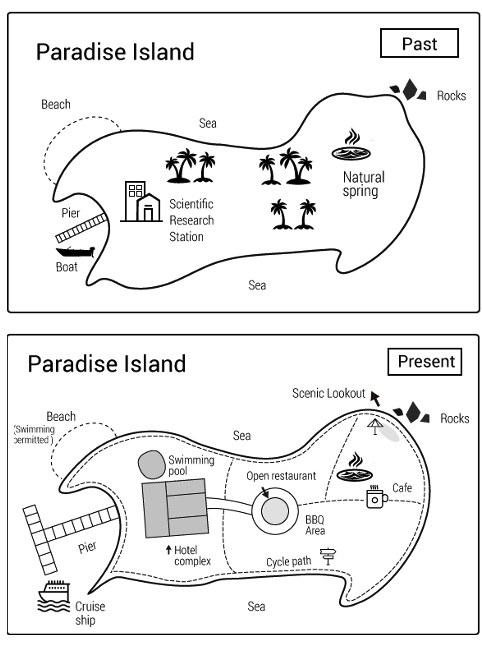
The maps show the change of Paradise Island from past to present
Summarize the information by selecting and reporting the main features, and make comparisons where relevant.
Write at least 150 words.
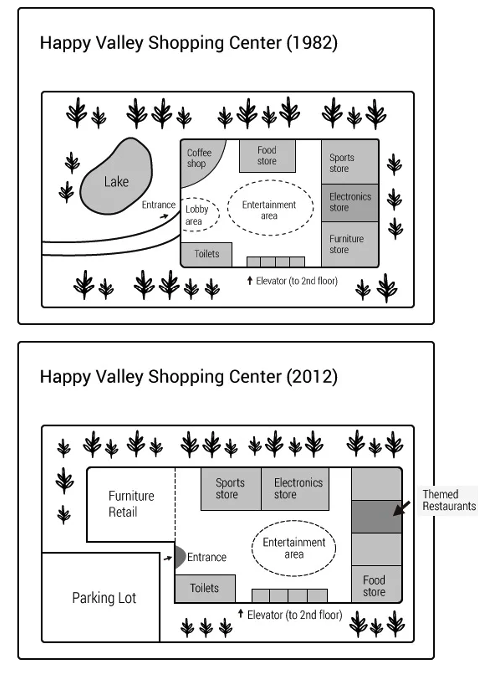
MAP 12
The maps show the change of Happy Valley Shopping Centre from 1982 to 2012
Summarize the information by selecting and reporting the main features, and make comparisons where relevant.
Write at least 150 words.
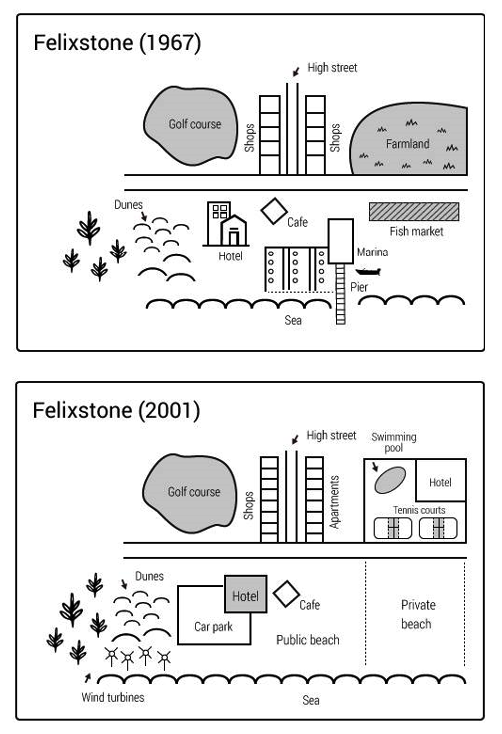
MAP 13
The maps show the change of Felixstone from 1967 to 2001
Summarize the information by selecting and reporting the main features, and make comparisons where relevant.
Write at least 150 words.
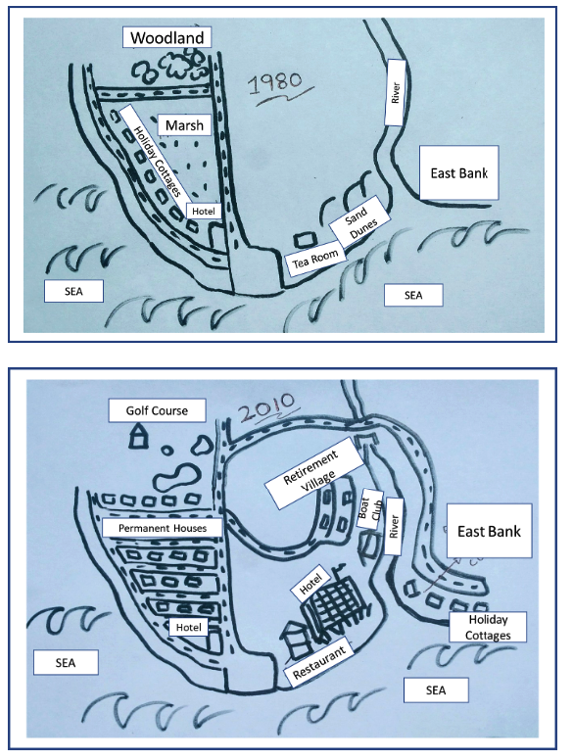
MAP 14
The diagrams below show the coastal village of Seaville in 1980 and 2010.
Summarize the information by selecting and reporting the main features, and make comparisons where relevant.
Write at least 150 words.
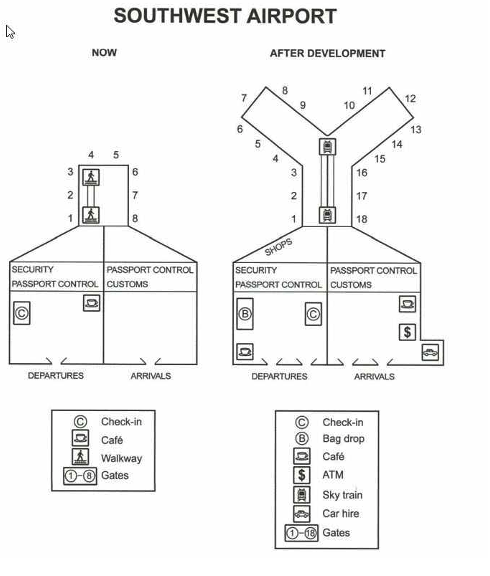
MAP 15
The plans below show the site of an airport now and how it will look after redevelopment next year.
Summarize the information by selecting and reporting the main features, and make comparisons where relevant.
Write at least 150 words.
MAP 16
The two maps below show road access to a city hospital in 2007 and in 2010.
Summarize the information by selecting and reporting the main features, and make comparisons where relevant.
Write at least 150 words.
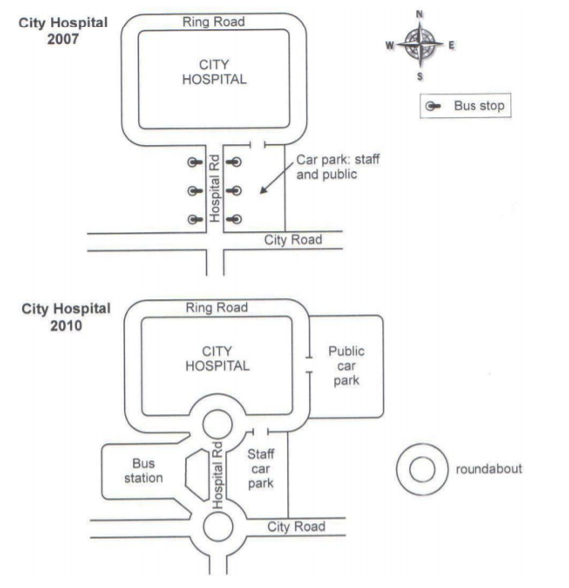
MAP 17
The maps below show the centre of a small town called Islip as it is now, and plans for its development.
Summarize the information by selecting and reporting the main features, and make comparisons where relevant.
Write at least 150 words.
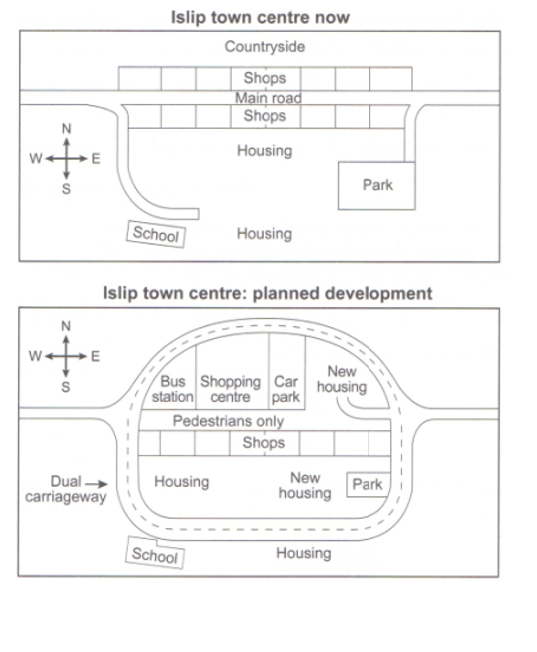
MAP 18
The maps below show an indutrial area in the town of Nortbiton, and planned future development of the site.
Summarize the information by selecting and reporting the main features, and make comparisons where relevant.
Write at least 150 words.
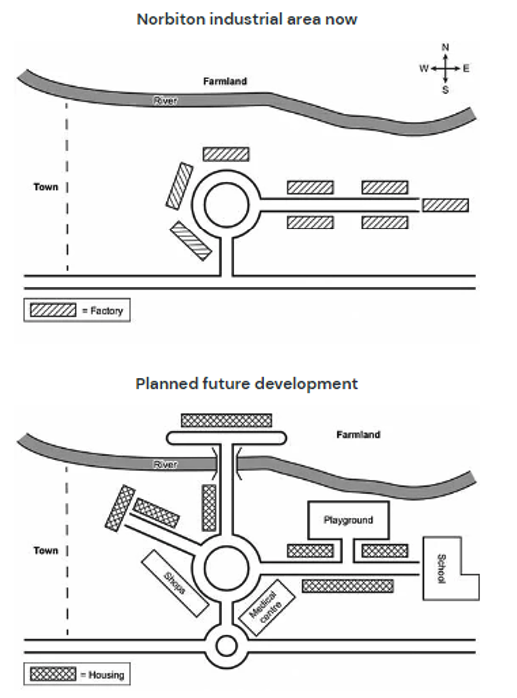
MAP 19
The plans below the layout of a university’s sports centre now, and how it will look after redevelopment
Summarize the information by selecting and reporting the main features, and make comparisons where relevant.
Write at least 150 words.
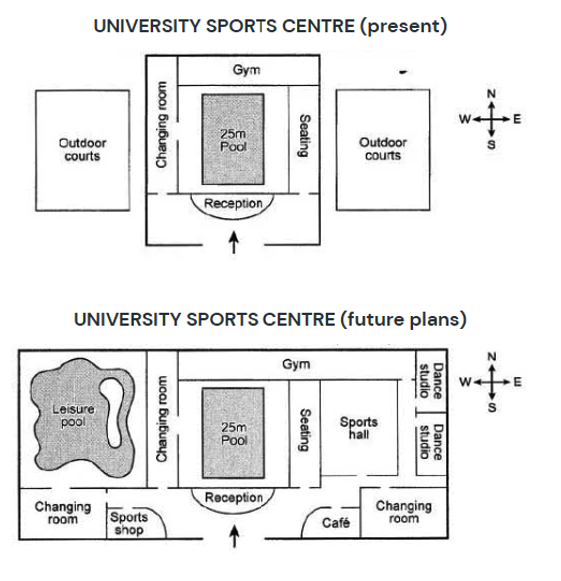
MAP 20
The plans below show a public park when it first opened in 1920 and the same park today
Summarize the information by selecting and reporting the main features, and make comparisons where relevant.
Write at least 150 words.
Sample Answer Band 9 - 1
The two maps below show an island, before and after the construction of some tourist facilities.
Write a report for a university lecturer describing the information shown below. Make comparisons where relevant.
You should write at least 150 words.
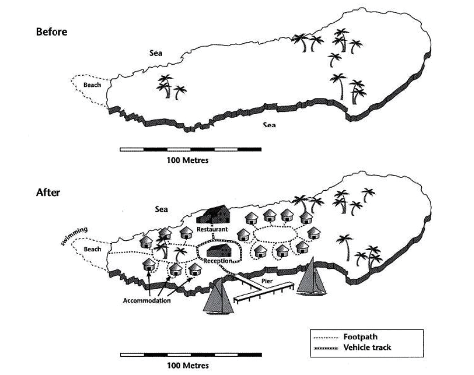
The diagrams illustrate some changes to a small island which has been developed for tourism.
It is clear that the island has changed considerably with the introduction of tourism, and six new features can be seen in the second diagram. The main developments are that the island is accessible and visitors have somewhere to stay.
Looking at the maps in more detail, we can see that small huts have been built to accommodate visitors to the island. The other physical structures that have been added are a reception building, in the middle of the island, and a restaurant to the north of the reception. Before these developments, the island was completely bare apart from a few trees.
As well as the buildings mentioned above, the new facilities on the island include a pier, where boats can dock. There is also a short road linking the pier with the reception and restaurant, and footpaths connect the huts. Finally, there is a designated swimming area for tourists off a beach on the western tip of the island.
(175 words)
Sample Answer Band 9 - 2
The maps below illustrate how Frenton changed from 1990 to 2012.
Write a report for a university lecturer describing the information shown below. Make comparisons where relevant.
You should write at least 150 words.
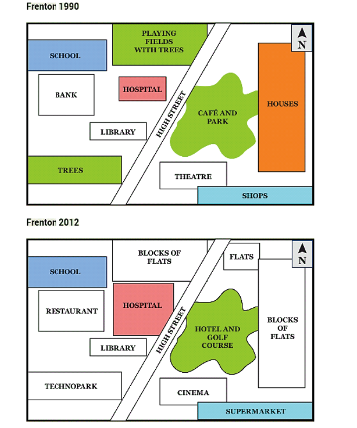
The maps show the developments that have taken place in Frenton over a period of 22 years between 1990 and 2012.
It is clear that Frenton underwent a dramatic transformation over the period, becoming noticeably less green and more built up.
The only places that remained the same in Frenton over the period were the school and the library. The playing fields in the south of the town , for example, were replaced with flats. Secondly, the houses in the west of Frenton were also made larger and factories were constructed on the site. Furthermore, the café and the park east of High Street made way for a hotel and golf course , while the theatre and shops became a cinema and supermarket, respectively.
The bank, located west of High Street and north of the school , was converted into a restaurant and the trees in the southwest of the town were cut down to make way for a technopark. One further development was the expansion of the hospital, located west of the High Street.
(175 words)